Dublin, March 03rd 2017 Last week the Shimmer team organised an exciting experiment here at Shimmer HQ. We wanted to test out the emotional response of an audience to advertising. So we gathered the team, strapped on our Shimmer NeuroLynQ sensors, and sat down to watch the best and the worst of 2017’s Super Bowl commercials.
Every year organisations are spending upwards of $5 million on a 30 second advertising slot during the Super Bowl. Add to this the production costs and the costs of promoting the commercials prior to and post-Super Bowl, and you’re looking at an eye-watering investment. With that much at stake, companies will want to be fairly certain of a return. But how do companies and advertisers really know what kind of material their audiences are going to engage with? Businesses are constantly looking for new insight into why customers behave the way they do, what they like, and what can turn them off a brand entirely. For years marketers and market research companies have utilised focus groups, surveys, questionnaires, interviews and ethnographic research to attempt to determine the kind of advertising that consumers are really connecting with, however gaining quantifiable and unbiased results from these techniques has been a constant struggle.
So what if marketers and advertisers could really get under the skin of their audiences and find out what makes them tick?
Enter neuromarketing – a new and innovative field of marketing which has grown exponentially over the past decade and incorporates everything from eye-tracking, facial coding and functional magnetic resonance imaging (fMRI) to electroencephalography EEG, galvanic skin response (GSR) and heart-rate tracking, to gain more in-depth insights into the emotions and implicit responses of consumers.
Shimmer has experienced proliferating interest from companies seeking to use wearable sensors to gain greater insight into their audiences’ and customers’ behavior and preferences from biometric data, and so we developed NeuroLynQ – a Shimmer solution developed with neuromarketers in mind, which measures the emotional response (by tracking heart-rate and galvanic skin response) of a large group of people to a stimulus.
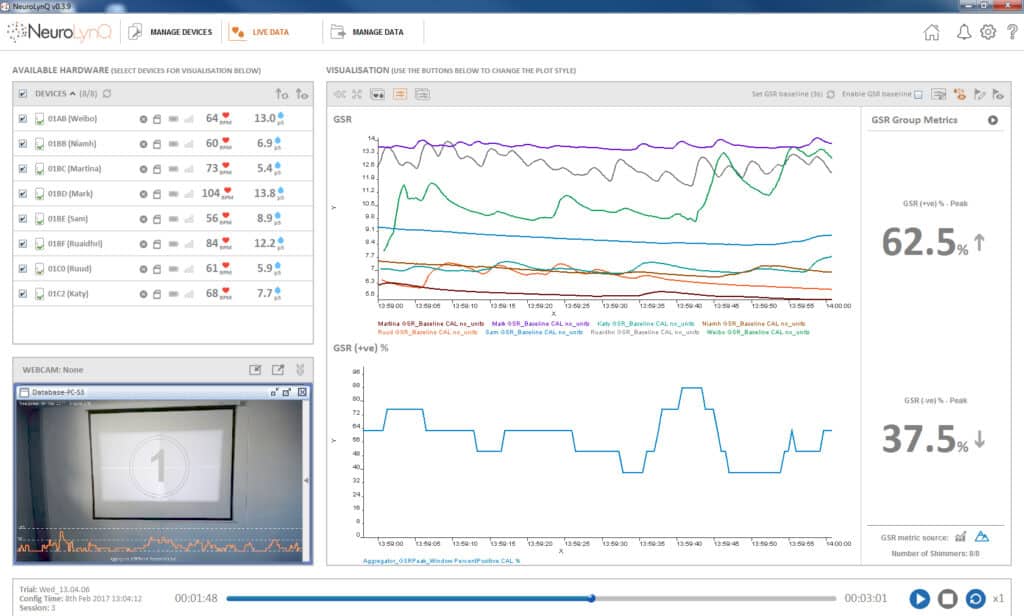
This leads back to our in-house experiment, which involved eight members of the Shimmer team watching a number of this year’s Super Bowl commercials (by Kia, Mr Clean, Wargaming and KFC) all while having our GSR and heart-rate data monitored and collected. Our engineers were able to track the groups’ response to the commercials live within the NeuroLynQ software. An algorithm within the software derives a group metric from each individual’s data so they could observe the general trend of the whole group in addition to the individual data from each participant.
Here is a quick summary of how the data looked:
– The general trend of the audience suggested that Kia’s commercial featuring Melissa McCarthy was the most visually engaging for the audience on the whole
– There was also a spike in engagement among most of the audience during the Mr. Clean commercial
– The highest positive peak for the audience as a whole was towards the climactic end of Kia’s commercial.
– The lowest positive peak for the group occurred during KFC’s commercial
– Heart rates for each individual participant tended to rise before each of the videos started – possibly signaling anticipation


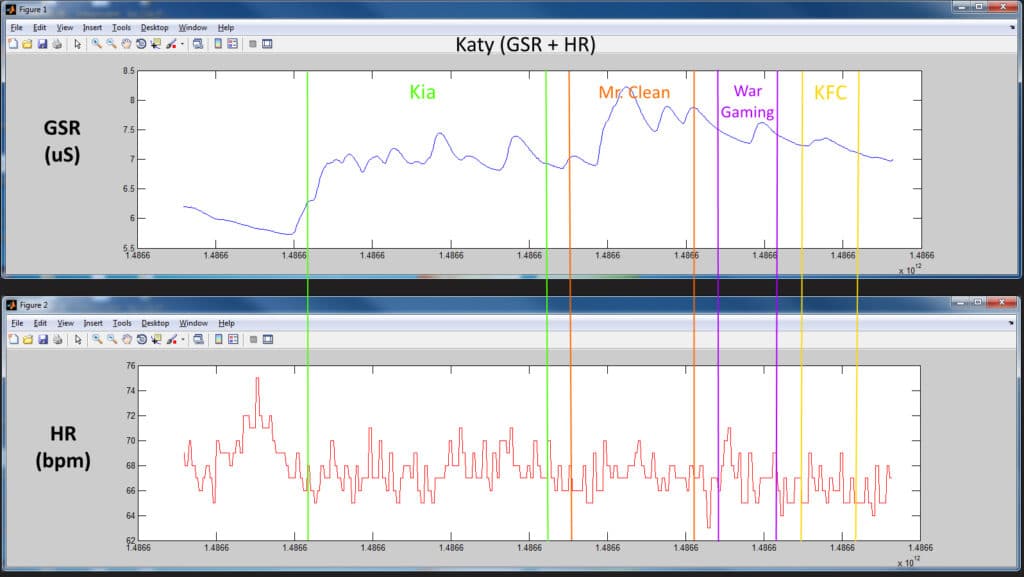
Looking at a single team member’s data from the experiment – we can observe the moments when her interest piques, as well as when it began to wane. This participant’s data shows a significant rise in GSR during the first commercial shown – the Kia commercial. Spikes in the data correspond with climactic moments within the commercial. A considerable GSR spike can also be observed during the Mr. Clean commercial, hitting a definite peak as the commercial’s protagonist appears and struts his stuff. The data shows that this Shimmer team member’s interest was spiked about 14 times in total over the course of the experiment, about 6 of these being significant peaks. The third and fourth commercials shown displayed a continuous decline in engagement, not just from this team member but from the group as a whole.
The experiment concluded with a brief interview with members of the team about their favorite commercials from the four shown. Our engineers then analysed the data to see whether our perceived enjoyment of each commercial correlated with our emotional response data. In general it did, but many people were not aware of certain points where their interest had spiked. It seems many of us were in denial about our “engagement” with Mr. Clean.*
Interestingly, this is actually a fairly common occurrence within focus groups. Much has been written about the potential for bias or false reporting by participants in focus groups, which means that for reasons such as the need for social acceptance, right down to our inability to recognize when our own interest is piqued, qualitative focus group data is often inaccurate and unreliable. The research participants’ own consciousness filters the data before it can ever be reported.
For this reason we can expect a continual increase in the use of biometric sensors and other technologies within market research for assessing and understanding audience engagement with advertising, products and brands. Experiments like this one show the value in having a more in-depth insight into consumers and their engagement.
Here are 3 of our key takeaways from the trial….
1. Heart rate and GSR data are both great tools for measuring emotional response data, providing a simple way to observe peaks and troughs in engagement.
2. Neuromarketing tools may prove invaluable to marketers and market researchers as research participants are often not entirely honest or even aware about their true response to advertising.
3. Mr. Clean has still got it
*It should be noted that this experiment was carried out in Dublin, Ireland where the majority of participants were not previously familiar with Mr. Clean.
About the Technology:
The system used in this experiment was Shimmer’s NeuroLynQ solution, which combines Electrocardiogram (ECG) and Galvanic Skin Response (GSR) data capture in a single wearable sensing device. Each member of the group (which can be up to 45 people) wears one of these devices on their wrist, with two electrodes positioned on the base of two of the participant’s fingers, one electrode placed on the inner wrist and another electrode positioned on the chest just below the collar bone. The data is streamed live from each device and is sychronised with the others to give both the individual’s emotional response to the stimulus as well as the overall response of the group.
By providing aggregated data, it is possible to identify the point in a commercial, film or other stimulus at which the majority of the audience is engaged with the content. It is also possible to calculate the average heart rate or GSR of the audience members at any point in the recording session, which gives a significant advantage over measuring from individuals, whose heart rate or GSR could be affected by other variables. Measuring from a group gives a much better idea to the researcher of the entire audiences’ engagement with the stimulus.
NeuroLynQ software allows for live visualisation of the data as it is streamed, as well as offering post-experiment playback of the data. The software can be connected to a webcam which can record the experiment, so that the researcher can observe the entire experiment in playback mode with the data overlaid.
Click here to learn more about the technology used for this experiment


