
Background & Objectives
The experience of negative emotions in everyday life, such as anger and anxiety, can have adverse effects on long-term cardiovascular health. However, objective measurements provided by mobile technology can promote insight into this psychobiological process and promote self-awareness and adaptive coping.
Researchers at Liverpool John Moores University have endeavored to create a mobile lifelogging platform to support this approach by continuously recording data via mobile/wearable devices and processing this information to measure physiological correlates of negative emotions.
System Overview
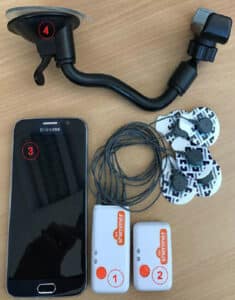
A mobile lifelogging platform was developed to measure anxiety and anger during real-life driving. The platform incorporates a number of wearable sensors and mobile devices to capture specific streams of driving data, including speed, distance travelled and photographs, as well as physiological data, which has been obtained from an electrocardiogram (ECG). This device has been used to measure two dimensions of cardiovascular activity, including heart rate (HR) and heart rate variability (HRV), specifically the high frequency component of HRV.
This system is different from a wide body of already existing work in that it doesn’t require any manual input from the participants. In order to be truly pervasive, sensing and measuring emotion needs to occur unobtrusively. The inclusion of physiological data is important as well because it is capable of predicting emotional states.

Advancing Previous Work
Previous research on measurement of stress in the real-world using ambulatory sensors has focused on quantification of perceived stress. For example, mobile monitoring data derived from the cStress model was used to successfully predict 72% of self-reported stress. The use of self-reported stress as a ‘ground truth’ is associated with a number of problems. In the first instance, these data can be very inconsistent. The second problem with reliance on subjective self-report concerns the role of unconscious psychological processes. Models of psychological stress have recently developed to embrace physiological changes that may be related to unconscious psychological processes, such as rumination. Relying on subjective self-report data effectively restricts the explanatory power of physiological markers to that component of psychological stress that is consciously experienced by a person.
The approach used in this case was to develop a psychophysiological profile of stress and other negative emotional states based upon previous research literature. The importance of this will be discussed later on in the case study.
Integrating Shimmer
Shimmer ECG and IMU sensors were used to develop a lifelogging platform to measure negative emotional states during real-life driving. The data that has been collected includes acceleration (to calculate speed), photographs of the road in front and ECG signals (to calculate cardiovascular activity).
Each participant undertook the study for five working days and recorded data during each of their driving journeys to and from work. A minimum of 20 minutes of continuous driving per journey was required to ensure a sufficient period of data collection. Before commencing the study, participants were briefed with a description of the task and received a demonstration of how to use the equipment. Once the participants had reached their destination, they were then required to stop recording data and remove the equipment.
Once finished, all of the collected data was analyzed using three-minute windows (minimum epoch necessary for analysis of HRV). Before calculating HR, the ECG signal was filtered using a Chebyshev Type I 2nd order highpass/lowpass filter with a cutoff frequency between 0.5 and 200 Hz. Once filtered, the R-R intervals were calculated to subsequently calculate HR in BPM and HRV. The acceleration signal was also filtered using a 1st order Butterwoth low-pass filter; speed was then calculated from this signal by combining the acceleration vectors (x, y, and z) into one vector and converting this acceleration signal (captured in m/s2 into velocity).
Data Analysis
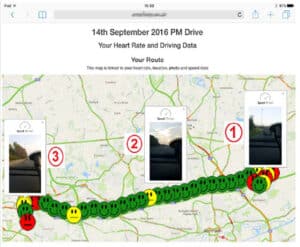
The purpose of the analysis was to quantify the relationship between vehicle speed and two measures of cardiovascular activity: heart rate (HR) and high frequency component of heart rate variability (HRV). The former provides an index of autonomic activation and has been associated with anger. The HRV measure is used to quantify vagal tone and has an inverse relationship with inflammation.
Significant correlations between mean speed and either HR or HRV were found for ten of the thirteen participants (77%). When the relationship was significant, both HR and HRV had a negative (inverse) relationship with mean speed. Therefore, low mean speed was associated with increased HR, which was indicative of anger due to journey impedance.
On this basis, it was expected that inflammation would also increase when mean speed was low. However, the opposite pattern was observed, and high mean speed was associated with low HRV. This unexpected result may be due to the influence of mental workload on cardiovascular activity. If you have a similar application, or would like to learn more about the full study, please get in contact with us at info@shimmersensing.com.